Purchasing a BackpAQ
BackpAQ V4 is available ready-to-use from our Tindie store. This is the easiest way to get started — the unit arrives assembled, tested and ready to pair with your phone.
If you prefer to build your own, full instructions and a parts list are available on Instructables. The open-source design means you can customize it for your classroom or research needs.
A BackpAQ V4 from the Tindie store includes the fully assembled sensor unit with enclosure, a USB charging cable, and quick-start instructions. The BackpAQ mobile app (iOS and Android) and AIView dashboard are free to use — no subscription required.
Yes — BackpAQ is fully open-source. The complete build guide, circuit diagrams, firmware, and parts list are published on Instructables. You'll need basic electronics skills and access to a soldering iron. Total parts cost is typically under $150.
How BackpAQ works
BackpAQ V4 measures six air quality parameters in real time:
- PM1, PM2.5, PM10 — fine and coarse particulate matter (microscopic particles that can enter the lungs)
- CO2 — carbon dioxide, an indicator of ventilation quality indoors
- NO2 — nitrogen dioxide, a gas linked to vehicle exhaust and combustion
- VOC — volatile organic compounds, emitted by paints, cleaners, and vehicle exhaust
Readings update once per minute and are transmitted over Wi-Fi or stored on the built-in SD card.
The BackpAQ mobile app (available for iOS and Android via the Blynk platform) connects to your BackpAQ sensor over Wi-Fi. It displays live readings on a map, lets you name and start recording tracks, and shows a breadcrumb trail of your exposure as you move through your environment.
The app syncs your data automatically to the BackpAQ cloud database, making it instantly available in the AIView dashboard.
AIView is BackpAQ's free web-based analytics and visualization dashboard, available at backpaqlabs.com/app. It lets you:
- View and replay your recorded tracks on an interactive map
- Chart PM2.5, CO2, NOx and VOC over time
- Compare your readings to the nearest EPA monitoring station
- Ask the AI Advisor (powered by Claude AI (Anthropic)) questions about your data
- Interact with AirBuddy — a real-time animated creature that reacts to your air quality
AIView works on desktop and mobile browsers, and can be installed as a Progressive Web App (PWA) on your phone's home screen.
Yes. BackpAQ works both indoors and outdoors. Indoors, CO2 readings are especially useful for assessing ventilation quality in classrooms, offices and other enclosed spaces. Note that GPS tracking is not available indoors, so map-based track visualization requires outdoor use.
BackpAQ setup & operation
Getting started with your BackpAQ V4 takes just a few minutes:
- Step 1 — Charge: Connect BackpAQ to a USB power source and charge fully before first use. The LED turns solid green when charged.
- Step 2 — Install the Blynk app: Download the free Blynk IoT app on your iOS or Android phone from the App Store or Google Play. Create a free Blynk account if you don't have one.
- Step 3 — Provision Wi-Fi via the app: Power on BackpAQ and open the Blynk app. Tap Add New Device and follow the four-step provisioning flow shown below — the app guides you through connecting BackpAQ to your Wi-Fi network automatically.
- Step 4 — Device connected: Once provisioned, BackpAQ appears live in the Blynk app within 30 seconds. You will see the Device Connected confirmation screen.
- Step 5 — Start a track: In the app, enter a track name and press Record. BackpAQ logs air quality readings with GPS location as you move. Use hyphens instead of spaces in track names (e.g. Morning-Walk not Morning Walk).
- Step 6 — View in AIView: Your data appears automatically in the BackpAQ AIView dashboard. Select your track to see the map, chart, and AI analysis.
Wi-Fi Provisioning via Blynk app — 4 simple steps:
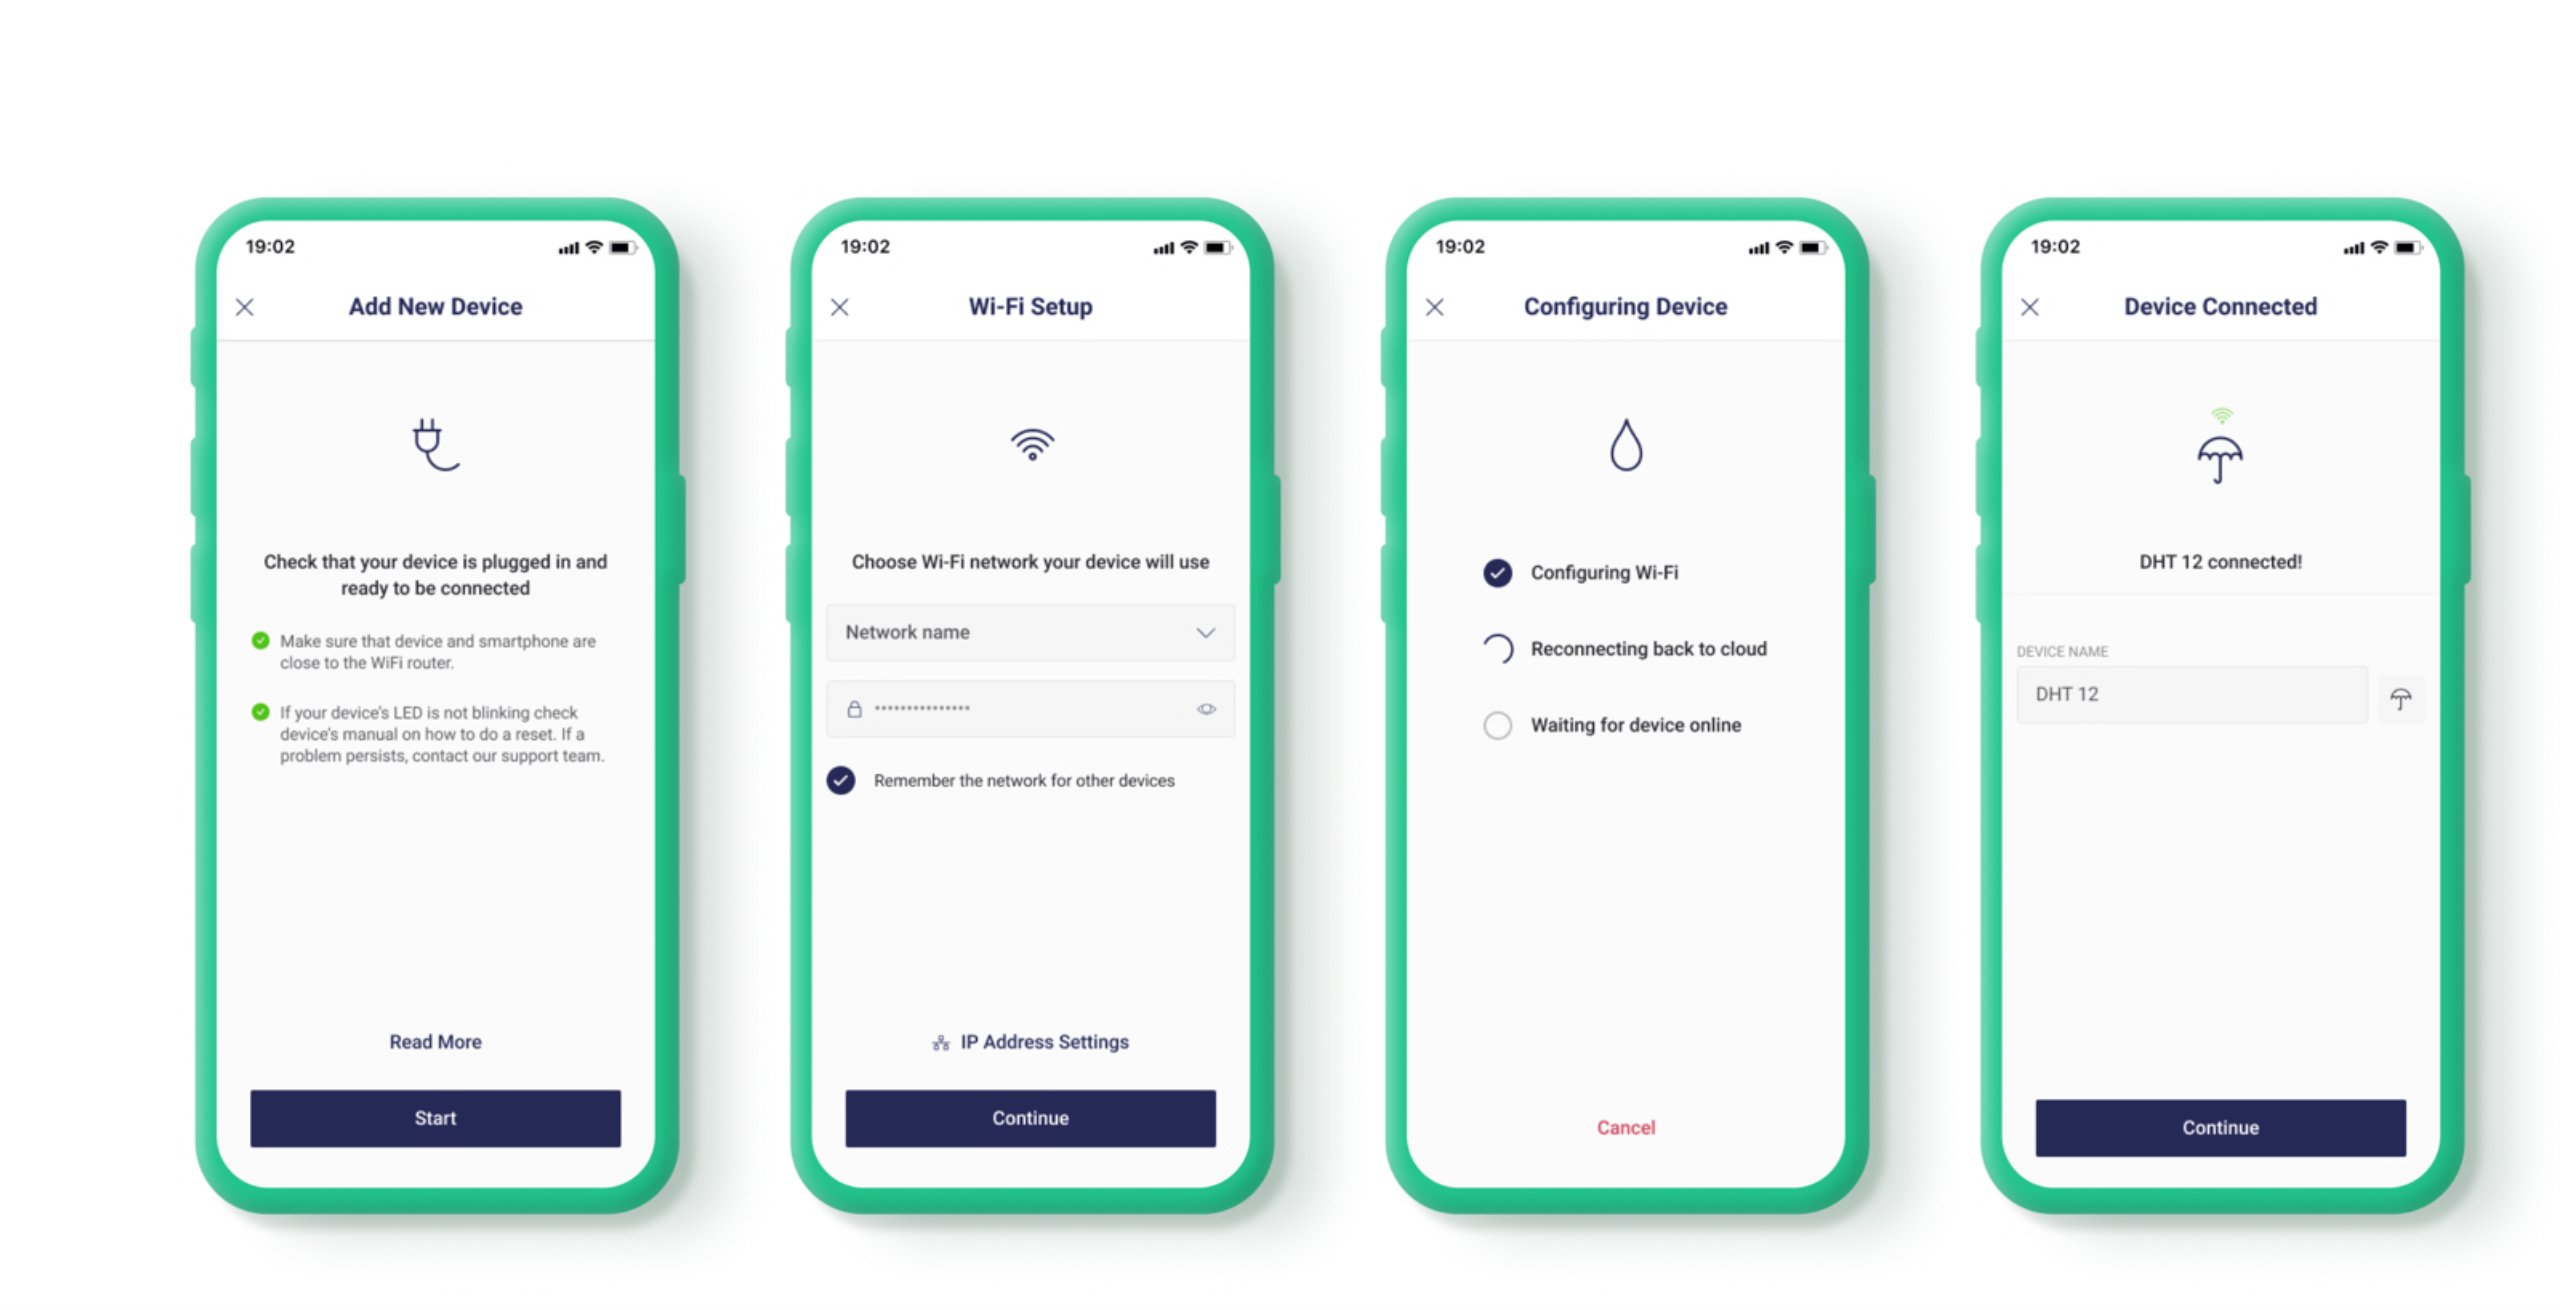
Plug in BackpAQ and make sure it is close to your phone and router
Choose your network and enter the password in the Blynk app
The app connects BackpAQ to your network and the Blynk cloud
BackpAQ is live — give it a name and start monitoring
If you entered the wrong Wi-Fi credentials, or need to connect BackpAQ to a different network, follow these steps:
Step 1 — Reset the device
Press and hold the WiFi Reset button (on the rear of BackpAQ) for 10 seconds. The LED will start flashing quickly — this means stored credentials have been cleared and the device is ready to be re-provisioned.
Step 2 — Open the Blynk app
Tap on your BackpAQ device in the app, then tap the three dots ⋯ in the top right corner. This opens the device information screen.
Step 3 — Choose Reconfigure
Tap the three dots ⋯ again in the top right corner of that screen. A dialog appears with four options:
- Reconfigure — use this to re-enter Wi-Fi credentials
- Erase all device data
- Delete Device
- Cancel
Tap Reconfigure — this takes you back into the same four-step provisioning flow used during initial setup.
Step 4 — Enter correct credentials
If the wrong network was selected or the password was entered incorrectly before, take care to enter the correct information rather than accepting any credentials the app may have stored from the previous attempt.
BackpAQ has two dedicated recording buttons on the front of the device — the Green (Start Recording) button and the Red (Stop Recording) button. These let you start and stop recording without needing Wi-Fi, the Blynk app, or a phone. This is ideal for field use — cycling, walking, or monitoring in areas without known Wi-Fi coverage.
How to use the recording buttons:
- Press the Green (Start Recording) button — starts recording. The display shows ● REC with an auto-generated track name (e.g. Track-0531-0914) based on the current date and time. Data is saved to the SD card or uploaded live depending on WiFi availability.
- Press the Red (Stop Recording) button — stops recording cleanly. The display shows ■ STOP and the track name for 2 seconds. Every data point is written immediately, so nothing is lost.
- WiFi Reset button (rear, hold 10 seconds) — resets Wi-Fi credentials. This is a separate button on the rear of the device, unrelated to recording.
Store and Forward: If you start a track on Wi-Fi via the Blynk app or the Green button and then move out of range, BackpAQ automatically switches to SD card storage — no action needed. When you return home and press Sync, all data uploads to InfluxDB seamlessly. AIView shows the complete track with 🌐 LIVE points from when Wi-Fi was connected and 💾 SD-SYNC points from offline sections.
Syncing your data: When you return to a known Wi-Fi network, press the Sync button in the Blynk app. BackpAQ uploads all SD card data to InfluxDB and your tracks appear in AIView automatically.
Track names are used to identify your sessions in the AIView dashboard and are stored as database tags — so the format matters. Follow these guidelines for the best experience:
- Use hyphens instead of spaces — e.g.
Morning-WalknotMorning Walk. Spaces in tag values require special handling and can cause issues in some cases. - Keep names short and descriptive — e.g.
School-Route-Mon,Park-Loop-PM,Bike-Trail-1. - Avoid special characters — commas, equals signs and quotes can cause database errors. Stick to letters, numbers and hyphens.
- Include useful context — adding a location or time of day makes tracks easier to find later, e.g.
Downtown-MorningorSchool-AQ-Study-3.
If you need to connect your BackpAQ to a different Wi-Fi network — for example when moving from home to school — follow these steps:
- Step 1 — Reset Wi-Fi: Hold the Config button on your BackpAQ for 5 seconds until the LED flashes blue. This clears the stored Wi-Fi credentials and restarts the device in hotspot mode.
- Step 2 — Connect to the hotspot: On your phone, go to Wi-Fi settings and connect to the BackpAQ-XXXXXX network that appears.
- Step 3 — Reconfigure via Blynk app: Open the Blynk app, tap your BackpAQ device, then tap the three dots ⋯ in the top right corner. Tap the three dots ⋯ again and choose Reconfigure. This takes you back into the same four-step provisioning flow used during initial setup.
- Step 4 — Enter correct credentials: Follow the provisioning flow to select your network and enter the correct password. BackpAQ will reconnect automatically once configured.
Uploading & managing your data
Your data is stored securely in InfluxDB Cloud — a professional time-series database used by researchers and engineers worldwide. Each data point is tagged with your device ID, track name, timestamp, GPS coordinates (where available), and all sensor readings.
The AIView dashboard queries this database in real time via a secure server-side proxy — your credentials are never exposed in the browser.
If your BackpAQ was out of Wi-Fi range during a session, data is automatically saved to the built-in SD card. To upload it:
- Remove the SD card from your BackpAQ unit
- Insert it into your computer using an SD card reader
- Use the BackpAQ SD Sync tool (available in the dashboard) to upload your files
SD card tracks are clearly marked with an "SD-SYNC" badge in the track list so you always know which data came from which source.
Yes. Every track in AIView has a Download button that exports your data as a CSV file. This file contains all sensor readings, timestamps and GPS coordinates for that track, and can be opened in Excel, Google Sheets, or any data analysis tool.
The AIView dashboard currently displays tracks from the last 60 days by default. Your data in InfluxDB Cloud is retained according to the bucket retention policy set for your account. For schools and research projects that need longer retention, please contact us to discuss options.
Sharing & data privacy
Your track data is associated with your device ID and is accessible to anyone with a BackpAQ account who uses the same InfluxDB bucket. In a classroom setting this means teachers and students sharing a device can all view the same tracks in AIView.
Photos attached to tracks are shared with all logged-in users — this is intentional, as BackpAQ is designed to support collaborative community science.
Yes — in several ways:
- CSV export — download your track data and share the file with anyone
- AI Advisor report — copy or share the AI-generated analysis of your track
- Screenshots — the map and chart views are designed to be screenshot-friendly for presentations and reports
Direct shareable links to individual tracks are on our roadmap for a future release.
BackpAQ accounts use secure password hashing (bcrypt) and session-based authentication. We do not sell or share personal information with third parties. API credentials for InfluxDB and AirNow are stored server-side and are never exposed to the browser.
AirBuddy, AI & Gamification
![]() AirBuddy is an animated creature that lives in the AIView dashboard and reacts to your air quality data in real time. When the air is clean (PM2.5 below 12 µg/m³) AirBuddy is green, bouncy and happy. As pollution rises it turns yellow, then orange, then red — squinting, drooping, and surrounded by smog particles.
AirBuddy is an animated creature that lives in the AIView dashboard and reacts to your air quality data in real time. When the air is clean (PM2.5 below 12 µg/m³) AirBuddy is green, bouncy and happy. As pollution rises it turns yellow, then orange, then red — squinting, drooping, and surrounded by smog particles.
AirBuddy also grows a flower garden, tracks your badge progress, displays an AQI color bar, and helps you draft student investigation reports — all powered by Claude AI.
Click the ✦ AirBuddy ✦ title at the top of the AirBuddy panel. It turns into a text field — type your chosen name (up to 16 characters) and press Enter or click away to save. Your name is remembered across sessions so AirBuddy greets you personally every time you return.
AirBuddy has two modes switchable via the toggle in the panel:
- Avg PM2.5 — AirBuddy reflects the average PM2.5 for the entire selected track. Good for understanding overall air quality on a journey.
- ▶ Live — AirBuddy reacts to each individual data point as you scrub or play through the track. Watch AirBuddy get sick as you pass a hotspot and recover as you move away.
The flower garden at the bottom of the AirBuddy panel is a living record of the air quality you've encountered. Flowers grow slowly in clean air (PM2.5 below 12 µg/m³) and wilt when pollution is high. A brown smog haze appears during polluted readings.
The garden state is saved to your device and persists across sessions — it grows over time as you collect more tracks. Students with clean routes will have lush gardens; those investigating polluted areas will see that reflected in wilting flowers.
There are three badges, each with Bronze 🥉, Silver 🥈 and Gold 🥇 levels. Progress bars in the AirBuddy panel show how close you are to the next level.
- 🗺️ Explorer — load tracks. Bronze: 5 tracks · Silver: 20 · Gold: 50.
- ⚠️ Air Detective — find pollution incidents (PM2.5 above 35 µg/m³). Bronze: 3 incidents · Silver: 10 · Gold: 25.
- 📋 Science Reporter — draft and submit student investigation reports. Bronze: 1 report · Silver: 5 · Gold: 10.
When you unlock a new badge level a notification appears on screen. Progress is saved to your device across sessions.
The AI Advisor is powered by Claude AI (Anthropic) and gives you instant scientific analysis of your track data. To use it:
- Load a track from the sidebar
- Click the ✨ Advisor button in the summary panel
- Claude analyzes your PM2.5, CO2, NOx and VOC readings alongside EPA regional context — fetched automatically
- Read the analysis and ask follow-up questions in the chat
AirBuddy suggests context-aware questions to get you started — for example, "Why did my PM2.5 spike at 10:10 AM?" or "How does this compare to the WHO safe limit?"
After running the AI Advisor, a 📋 Draft My Report button appears. Click it to open the report builder and fill in four sections in your own words:
- What I set out to investigate
- What I observed in the field
- What I think this means for my community
- Action I recommend
Click Copy My Report to Clipboard and paste into Google Docs, Google Classroom, or any other tool. The report includes your student writing, sensor data summary, AI scientific context (clearly labeled as a reference), and a data appendix with your top pollution readings.
Yes. When you click an EPA AirNow station marker on the map, AirBuddy automatically updates to reflect that station's current PM2.5 reading — so you can directly compare your BackpAQ hyperlocal readings against the official government monitor in your area.
After the AI Advisor has analyzed your track, a 📋 Draft My Report button appears at the bottom of the Advisor panel. Click it to open the Report Builder. The process has four steps:
- Step 1 — Read the AI analysis — the Advisor gives you scientific context, EPA comparisons, and health recommendations. Use this to inform your own writing.
- Step 2 — Fill in your observations — four fields ask what you set out to investigate, what you observed in the field, what it means for your community, and what action you recommend. These are your words, not the AI's.
- Step 3 — Add your name and school — optional, but required if you want to publish to the Student Experiences gallery.
- Step 4 — Choose your output — open a printable report, copy to clipboard for pasting into Google Docs or Canvas, or publish directly to the BackpAQ community gallery.
Clicking 🖨️ Open Printable Report opens a professionally formatted report in a new browser tab. It includes:
- Figure 1 — your GPS track map, color-coded by PM2.5 (green = Good, yellow = Moderate, red = Unhealthy)
- Figure 2 — your PM2.5 chart over time with EPA quality zone shading
- Your four written sections, clearly labeled as your own observations and conclusions
- The AI Advisor analysis, clearly labeled as AI-generated scientific reference
- Track metadata — date, device, duration, average and min/max PM2.5
To submit to your teacher: click the blue Print / Save as PDF button at the top of the report page. Your browser will open a print dialog — choose Save as PDF as the destination. You can then attach the PDF to Google Classroom, Canvas, or email.
The Student Experiences gallery is a public page on backpaqlabs.com where students can share their air quality investigations with the world. Each published report shows the track map, PM2.5 data, and the student's observations and recommendations.
To publish your report:
- In the Report Builder, fill in your name and school (optional but encouraged)
- Click 🌍 Publish to Community
- A confirmation dialog will appear — click OK to submit
- Your report is submitted for review and will appear in the gallery once approved
You can reach the gallery from several places:
- From the AIView dashboard — click the 🌍 Student Experiences button in the top header bar. It opens in a new tab so you don't lose your dashboard session.
- From the BackpAQ homepage — click 🌍 Experiences in the main navigation.
- Direct URL — backpaqlabs.com/experiences.php
On the gallery page you can search reports by track name, school or observation text, and sort by newest, highest PM2.5 or lowest PM2.5. Click Read Full Report → on any card to see the complete investigation including map and chart.
Cycling Mode
Cycling Mode is a special operating mode for the BackpAQ device designed for use on a bicycle. When enabled, it optimizes the display, data collection and analysis for cycling rather than walking:
- The on-device display switches to a cycling dashboard showing speed, PM2.5, distance ridden and clean air streak
- InfluxDB data uploads increase from every 60 seconds to every 30 seconds for more detailed route tracking
- Tracks are tagged as cycling in the AIView dashboard so they display with a 🚴 badge
- The AI Advisor gives cycling-specific analysis — traffic corridors, route hotspots, and clean route suggestions
In the Blynk app, tap the 🚴 Cycling Mode toggle button. The button turns green when active. Then press the Green (Start Recording) button on the front of BackpAQ, or start your session from the Blynk app as normal.
The on-device display switches from the standard sensor readout to a cycling-optimized layout with four rows:
- Speed — current speed in mph from GPS
- PM2.5 — current particulate reading in µg/m³
- Distance — total miles ridden this session
- Clean streak — consecutive minutes below 12 µg/m³, or "Polluted area" if above
The display updates every second so you get a real-time view of air quality as you ride.
Four widgets update in real time during a cycling session:
- PM2.5 Display — current PM2.5 with air quality category (GOOD / MOD / HIGH)
- Odometer — total miles ridden this session
- Speed Gauge — current speed in mph, range 0–40
- Clean Streak — consecutive minutes in clean air, or "Polluted" if PM2.5 is elevated
The Clean Air Streak counts consecutive minutes where PM2.5 stays below 12 µg/m³ — the EPA threshold for "Good" air quality. It resets to zero whenever pollution rises above that level.
A long streak means you have found a genuinely clean route. After 10 consecutive clean minutes the ride is flagged as a clean route in the database, which contributes to the 🟢 Clean Route Finder badge in AirBuddy.
When you open the AI Advisor on a cycling track it automatically detects the cycling mode tag and adjusts its analysis:
- Considers that you move faster, so exposure per location is shorter but the route covers more ground
- Identifies traffic corridor hotspots — intersections and arterial roads where pollution spikes
- Flags specific locations a cyclist should avoid or reroute around
- Compares bike path segments vs road segments for pollution differences
- Provides a 🚴 Cycling Route Assessment section with practical clean route recommendations
After loading a cycling track in AIView, click the 🚴 GPX button in the summary panel. This downloads a standard GPX file containing your full route with BackpAQ air quality data embedded as custom extensions (PM2.5, CO2, NOx, VOC at each GPS point).
The GPX file can be imported into:
- Strava — upload as a manual activity
- Komoot — import as a planned or completed route
- Garmin Connect — import for device sync
- RideWithGPS — full route visualization
- Google Maps / Google Earth — view the route with data overlay
Two badges are specifically designed for cyclists:
- 🟢 Clean Route Finder — awarded for discovering routes with 10+ consecutive minutes below 12 µg/m³. Bronze: 1 clean route · Silver: 5 · Gold: 10.
- 🚴 Route Sharer — awarded for exporting GPX files. Bronze: 1 export · Silver: 5 · Gold: 10.
Both badges appear in the AirBuddy panel with progress bars showing how close you are to the next level.
- Mount position matters — attach BackpAQ to the front of the bike or handlebar bag rather than a rear rack. Placing it behind you near the rear wheel picks up your own bike's exhaust-displaced air and road dust.
- Wait for GPS lock — check the GPS lock indicator in Blynk before starting your session. A green GPS LED means accurate location data.
- Enable Cycling Mode before recording — the mode tag is written at the start of each track point so the full ride is correctly identified.
- Ride the same route multiple times — air quality varies by time of day, day of week, and weather. Multiple rides on the same route build a more complete picture.
- Note pollution spikes in real time — use the Blynk terminal (V70) to add comments at specific locations ("heavy truck", "construction", "bus stop") for richer AI analysis later.
- Compare morning vs evening routes — traffic patterns and temperature inversions cause significant variation. Morning rides often show higher pollution in valleys and near schools.
Experiments & Investigations
BackpAQ investigations are designed to support the Next Generation Science Standards (NGSS) three-dimensional learning framework. Every experiment combines Science and Engineering Practices, Disciplinary Core Ideas, and Crosscutting Concepts.
Core NGSS Standards addressed across all BackpAQ experiments:
- MS-ESS3-3 — Apply scientific principles to design a method for monitoring and minimizing a human impact on the environment
- HS-ESS3-6 — Use a computational representation to illustrate the relationships among Earth systems and how those relationships are being modified due to human activity
- MS-ESS3-4 — Construct an argument supported by evidence for how increases in human population and per-capita consumption of natural resources impact Earth's systems
Science and Engineering Practices used:
- Planning and Carrying Out Investigations
- Analyzing and Interpreting Data
- Constructing Explanations and Designing Solutions
- Engaging in Argument from Evidence
- Obtaining, Evaluating, and Communicating Information
Crosscutting Concepts addressed:
- Cause and Effect — what causes PM2.5 to spike at specific locations?
- Patterns — how does air quality vary by time, weather, and location?
- Systems and System Models — how do traffic, weather, and geography interact to determine air quality?
- Stability and Change — what makes air quality better or worse over time?
Every BackpAQ investigation follows the same scientific method:
- Question — what do you want to find out? (e.g. "Is the air near the school entrance worse during drop-off time?")
- Hypothesis — what do you predict and why?
- Data collection — record a BackpAQ track at the location and time of interest
- Analysis — load the track in AIView, examine the map and chart, open the AI Advisor
- Conclusion — use the Report Assistant to write up your findings
The experiments below are designed to work with BackpAQ, AIView and the AI Advisor out of the box — no additional equipment needed.
Grade level: 6–12 | Time: 3 sessions across one day
Question: Does air quality at the same location change throughout the day?
Hypothesis: Air quality is worse during morning and evening rush hours when more vehicles are on the road.
Procedure:
- Record three BackpAQ tracks at the same location — one in the early morning (7–8am), one at midday (12–1pm), one in the evening (5–6pm)
- Walk the same route each time so the comparison is fair
- Name tracks clearly: Morning-Walk, Midday-Walk, Evening-Walk
In AIView: Load each track and note the average PM2.5. Use the calendar heatmap to compare the three tracks side by side.
Ask the AI Advisor: "How do these three PM2.5 readings compare to each other and to the EPA station? What explains the differences?"
What to look for: PM2.5 spikes on the chart coinciding with passing vehicles. Higher baseline readings during rush hours. Compare your local BackpAQ readings to the nearest EPA station — do they follow the same pattern?
Grade level: 6–12 | Time: 1–2 sessions
Question: Is the air inside our school building cleaner or dirtier than outside?
Hypothesis: Indoor air is cleaner because the building filters out outdoor pollution.
Procedure:
- Record a 10-minute track inside a classroom with the HVAC running
- Record a 10-minute track outside near the school entrance
- Record a 10-minute track outside on the playing field away from traffic
- Keep BackpAQ at the same height and away from people's breath for each measurement
In AIView: Compare the average PM2.5 and CO2 for each track. High CO2 indoors with low PM2.5 suggests good filtration but poor ventilation.
Ask the AI Advisor: "What do the CO2 and PM2.5 readings tell us about the air quality and ventilation in each location?"
What to look for: CO2 is a good indicator of ventilation — high CO2 means stale air. PM2.5 indicates particle pollution. A well-ventilated room should have low CO2 AND low PM2.5.
Grade level: 7–12 | Time: 1 session
Question: How quickly does PM2.5 drop as you move away from a busy road?
Hypothesis: PM2.5 drops significantly within 100 meters of a busy road.
Procedure:
- Find a busy road near your school
- Record a track walking directly away from the road — stand at 5m, 20m, 50m, 100m, 200m for 2 minutes each
- Note wind direction — try to walk downwind for strongest effect
- Mark each position with a comment in the Blynk terminal
In AIView: The map will show your path with color-coded PM2.5. The chart will show the drop-off pattern over time. Click each point to see the reading at each distance.
Ask the AI Advisor: "At what distance from the road did PM2.5 reach background levels? What does this suggest about safe locations for a school playground?"
Grade level: 7–12 | Time: Multiple sessions over 1–2 weeks
Question: Does weather affect air quality at our school?
Hypothesis: Wind disperses pollution, rain cleans the air, and calm conditions trap pollution near the ground.
Procedure:
- Record the same 10-minute walk each school day for two weeks
- Note weather conditions each day: wind speed/direction, temperature, humidity, recent rain
- Use the same track name format: Weather-Study-MMDD
In AIView: Use the calendar heatmap to see how PM2.5 varies day to day. Look for patterns matching windy days, rainy days, and still days.
Ask the AI Advisor: "Based on these readings over two weeks, what weather conditions produce the worst and best air quality at our location?"
What to look for: Temperature inversions (cold air trapped under warm air) often produce high PM2.5 on calm mornings. Rain typically drops PM2.5 dramatically. Wind direction matters — pollution is higher when wind blows from a busy road toward your school.
- MS-ESS2-5 — Collect data to provide evidence for how the motions and complex interactions of air masses result in changes in weather conditions
- MS-ESS3-3 — Apply scientific principles to design a method for monitoring and minimizing a human impact on the environment
- HS-ESS2-4 — Use a model to describe how variations in the flow of energy into and out of Earth's systems result in changes in climate
Grade level: 6–12 | Time: 2 sessions
Question: Is there a route to school with cleaner air than the one I normally take?
Hypothesis: Routes through residential streets or parks have lower PM2.5 than routes along arterial roads.
Procedure:
- Enable Cycling Mode in the Blynk app
- Ride or walk Route A (your normal route) and record a track named RouteA-MMDD
- On a different day, ride Route B (an alternative path) and record RouteB-MMDD
- Try to travel at the same time of day for a fair comparison
In AIView: Load each track and compare average PM2.5, peak readings and clean air streak. Export both as GPX files to overlay the routes.
Ask the AI Advisor: "Compare these two routes — which exposes a cyclist to less air pollution overall, and which specific sections of each route are the most polluted?"
Grade level: 6–12 | Time: Before and during a specific event
Question: How does a specific event change the air quality at our school or neighborhood?
Suitable events: school bonfire, car show, food truck rally, construction project, wildfire smoke day, sports day with diesel buses, leaf blowing
Procedure:
- Record a baseline track the day before the event at the same location and time
- Record a track during the event
- Record a recovery track the day after to see how long effects last
- Name tracks: Before-Event, During-Event, After-Event
In AIView: Compare the three tracks. Look for when PM2.5 peaked, how high it went and how quickly it returned to baseline.
Ask the AI Advisor: "Based on the Before, During and After tracks, what was the impact of this event on local air quality, and how long did the effect last?"
- MS-ESS3-3 — Apply scientific principles to design a method for monitoring and minimizing a human impact on the environment
- HS-ESS3-1 — Construct an explanation based on evidence for how the availability of natural resources, occurrence of natural hazards, and changes in climate have influenced human activity
After collecting your data and loading a track in AIView, the AI Advisor and Report Assistant work together to help you complete a full scientific investigation:
Step 1 — AI Advisor: Click the ✨ Advisor button on any track. The AI automatically analyzes your PM2.5, CO2, NOx and VOC readings, compares them to the nearest EPA station, identifies pollution hotspots, and gives you a scientific grade for the air quality. Read the analysis carefully — it gives you the vocabulary and scientific context to write your report.
Step 2 — Report Assistant: After the AI analysis, the Report Assistant appears. Fill in your own observations in each section — your hypothesis, what you noticed in the field, and your conclusions. The AI provides the science; you provide the human observations and judgment.
Step 3 — Submit: Copy the completed report and submit it to your teacher. The report includes the AI analysis, your observations, EPA comparison data, and your scientific conclusions.
Still have a question?
We're adding new answers all the time. If you can't find what you're looking for, reach out directly.
Ask us a question →